Most of the time, ChatGPT’s writing does not sound like it came from a human. That’s where this article comes in. We’re here to show you how to solve this problem for good and make ChatGPT write like a human so you can cheat on your homework, write your cringe wedding vows, or even get your ex back. Not really, though.
These prompts will help you make ChatGPT produce content that feels authentically human and fantastically real.
Prefer listening? Play the podcast version below! If not, just keep reading.
Understanding Human-like Content
So, what does “human-like” content even mean? How does something sound human? Well, it involves several key elements:
- Personas: Tailoring the AI’s voice to mimic a specific individual.
- Personal Experience: Incorporating unique stories and insights.
- Fact Insertion: Using up-to-date and relevant data.
- Perplexity and Burstiness: Varying sentence structure and vocabulary.
AI is not good at naturally doing these things unless you specifically instruct it to do them. So, now you have a new job: hack ChatGPT’s natural robotic voice and replace it with one that sounds like it has a pulse. You’ll be fooling everyone in no time. Let’s party.
Effective Prompts to Humanize ChatGPT
1. Make ChatGPT Write Like You
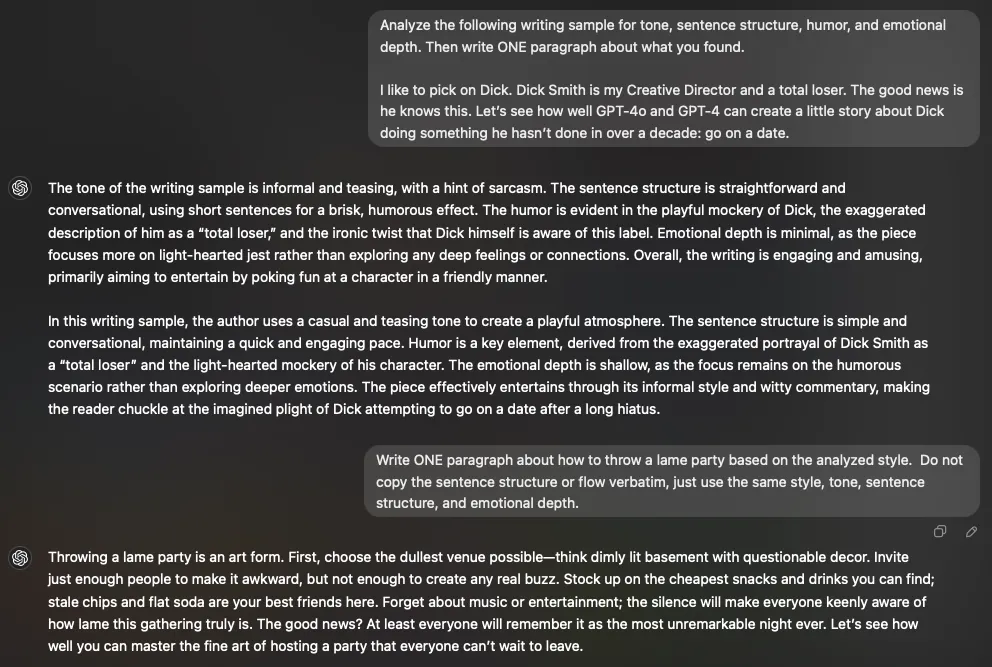
To make ChatGPT write like you, simply provide an example of your writing and follow these instructions and prompts.
Step 1. First, simply run this prompt.
(Copy/Paste Prompt into ChatGPT)
Analyze the following writing sample for tone, sentence structure, humor, and emotional depth. Then write ONE paragraph about what you found.
[Insert Writing Sample]
Step 2. Next, run this prompt immediately after it in the same chat.
(Copy/Paste Prompt into ChatGPT)
Write [one paragraph/two paragraphs/500 words/etc.] about [your subject or topic] based on the analyzed style. Do not copy the sentence structure or flow verbatim, just use the same style, tone, sentence structure, and emotional depth.

2. Insert Facts Into ChatGPT’s Content
Using recent and specific data can make AI content more credible and human-sounding.
(Copy/Paste Prompt into ChatGPT)
Write [one paragraph/two paragraphs/500 words/etc.] about [your subject or topic]. Use these facts in the content.
Fact 1: [Add a fact you want in your content]
Fact 2: [Add another fact you want in your content]

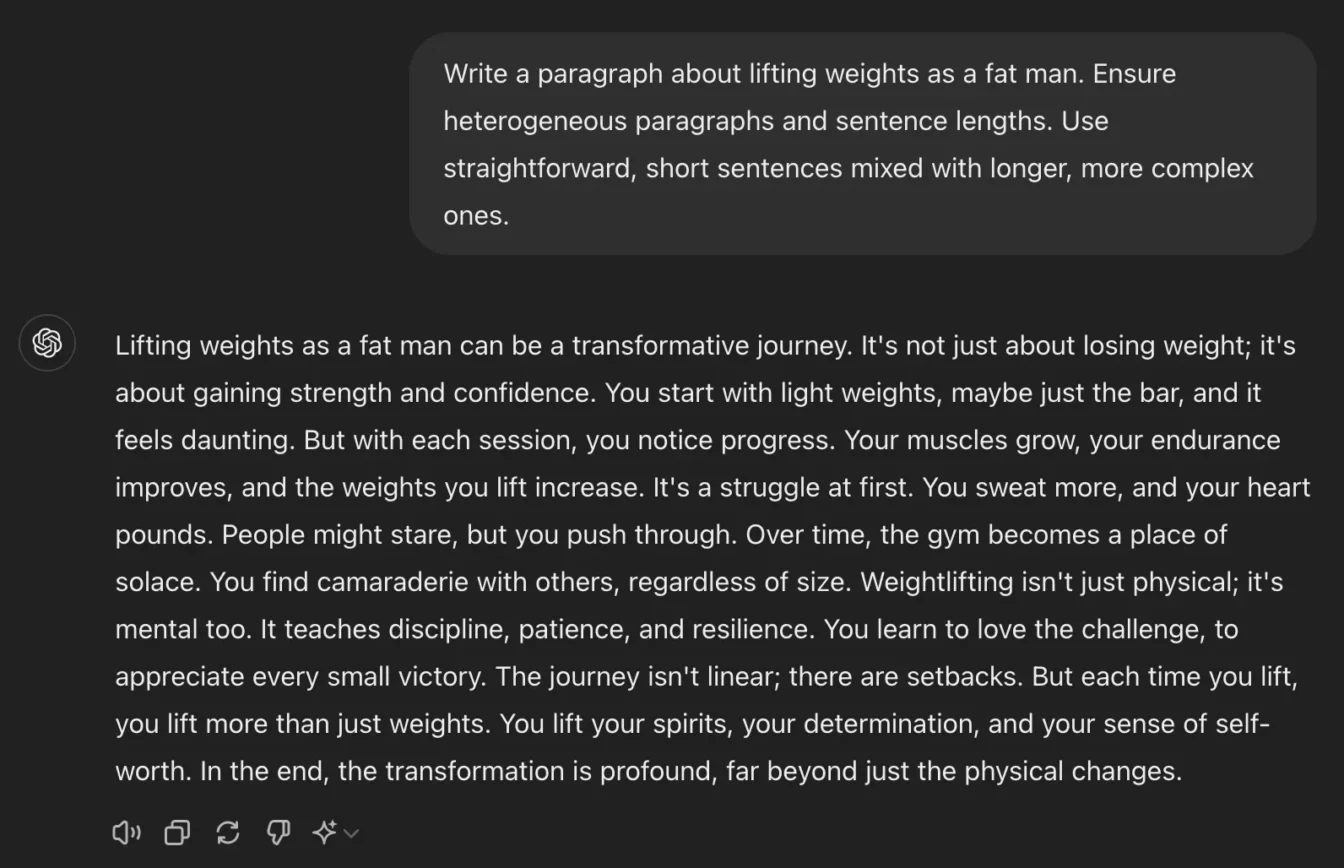
3. Add Perplexity and Burstiness
Avoid repetitive and robotic language by varying sentence length and structure. I bet you didn’t see this one coming. And no, we aren’t referring to Perplexity AI here. That’s something different.
(Copy/Paste Prompt into ChatGPT)
Write [one paragraph, 400 words, etc.] about [topic]. Ensure heterogeneous paragraphs and sentence lengths. Use straightforward, short sentences mixed with longer, more complex ones.

Combining ChatGPT Prompts for the Maximum Human Effect
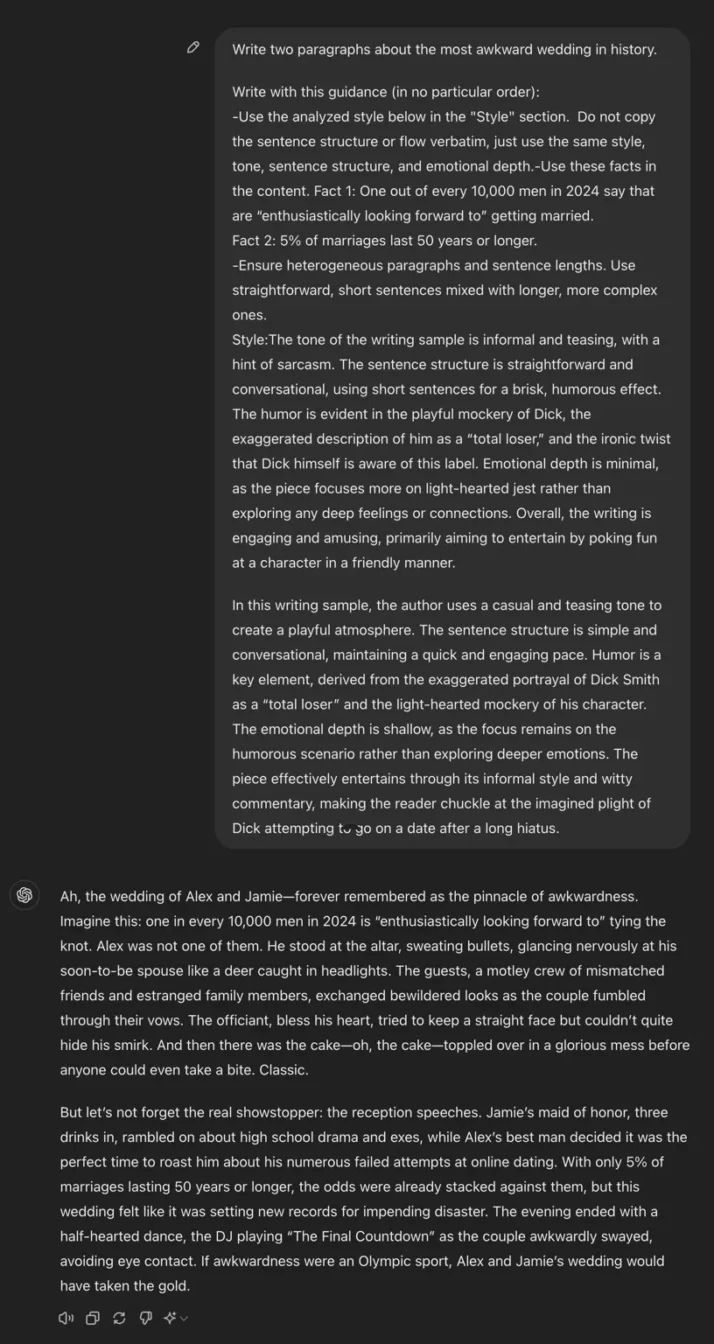
Want the final solution? Using these prompts together can significantly improve the human-like quality of your content, all at once.
(Copy/Paste Prompt into ChatGPT)
Write [one paragraph, 500 words, etc.] about [topic].
Write with this guidance (in no particular order):
-Use the analyzed style below in the “Style” section. Do not copy the sentence structure or flow verbatim, just use the same style, tone, sentence structure, and emotional depth.
-Use these facts in the content.
Fact 1: [Add a fact you want in your content]
Fact 2: [Add another fact you want in your content]
-Ensure heterogeneous paragraphs and sentence lengths. Use straightforward, short sentences mixed with longer, more complex ones.
Style:
[Enter the writing style description ChatGPT produced from the first prompt on this page]

BONUS: Chat with a Human Being (Kind of!)

Want to chat with a human being?
I’m not sure why anyone would want to do that, and that’s why we created Human Being. Human Being is a GPT (bot) that we created to sound as human-like as possible.
It’s currently rated 4.5 out of 5 stars and has over 1,000 chats. See why so many people are running the prompts with Human Being.
Chat with Human Being today for free, and check out our other GPTs in the one and only GPT Gallery.
Wrapping it up
By following these guidelines and running these prompts, you can significantly enhance the human-like quality of your AI-generated content. This approach not only improves readability but also engages your audience more effectively.
Also, be sure to check out our guide on Claude’s custom writing style tool to easily create different writing styles for your projects.
If you found this guide helpful at all, then please do us a huge favor and share this content with all of your coworkers, your entire LinkedIn network, and everyone in your phone’s contacts. If you don’t, we’ll find out. Not really, though.
If you like ChatGPT, you'll love Venice. Venice is private and uncensored! Try Venice today for free or get 20% off Venice Pro for a limited time with promo code "RUN20".

